How many Easy positions does Chicken Road 2 have?
The sequel has 30 Easy positions, beginning at ×1.01 and ending at ×23.24. The original Easy road uses a different sequence.

Demo credits have no withdrawal value. Explore the controls. Adults 18+ only.
Published theoretical return: 95.5% · Maximum game payout: 20,000 USD
Read this game’s reviewThe sequel uses different numbers throughout its four difficulties. Its Easy road has more positions than the original’s, and its permitted stake starts higher. A casino listing may show both games beside each other, so use the full title and provider name when opening a demo. Similar artwork is less useful than an exact game label.
The sequel’s permitted stake range is 0.12–200 USD. That is the amount range inside the game, separate from any minimum deposit in a casino cashier. If the account balance uses another currency, read the amount shown at the game control and the operator’s conversion terms before beginning a cash attempt.
Changing the stake changes how much money is exposed to the round. It does not make the next step more predictable. After a successful move, compare the gross return currently available with the choice to continue. A reached return stays uncertain until you collect, and a losing move can end the attempt.
Easy has 30 positions and begins at ×1.01. The following coefficients include ×1.03, ×1.06 and ×1.10. Its final multiplier is ×23.24. Those opening values make the difference from the original visible immediately, even before you compare the full table. A familiar Easy name does not mean an identical ladder.
Read the positions in order during a demo. Notice the current return after a successful move and the next coefficient offered. You can collect before reaching the endpoint; the table does not set a target for the round. Seeing where the collect action ends the attempt is more useful than waiting for a dramatic finish.
The sequel’s Medium road has 25 positions, beginning at ×1.08 and ending at ×2,457. Its starting value is below the original Medium opening, while its endpoint is different too. Keep the whole sequence attached to Chicken Road 2 when comparing tables, rather than mixing attractive figures from both versions.
A longer road offers more listed positions, not a promise that your chicken will reach them. The choice to advance remains a gamble on another result. If you want to compare neighbouring multipliers, use practice credits and read the ladder beside the game. You do not need to increase a cash stake to see the difference.
Hard gives the sequel 22 positions. It opens at ×1.18 and reaches ×62,162.09 at the endpoint. The multiplier jumps grow sharply later in the road, so the next amount can draw attention away from the return already available. Read both figures before deciding what an additional move would put at risk.
Switching to Hard should be a deliberate selection rather than an unnoticed result of a lobby shortcut. Check the label when the game loads and after moving between practice and cash. If the stake or selected mode looks different from what you expected, leave the round unstarted until the screen is clear.
Daredevil has 18 positions, starting at ×1.44 and ending at ×3,608,855.25. This is the sequel’s shortest road and its largest final coefficient. That endpoint attracts attention, but the maximum game win is 20,000 USD. The payment ceiling still matters when a stake multiplied by a coefficient would exceed it.
Keep the cap beside the ladder whenever you compare possible amounts. A final coefficient describes a game position; it does not describe a bank withdrawal you can expect. The casino’s cashier may add separate withdrawal conditions. Those account rules should be read before depositing, rather than after seeing a large return on the screen.
Chicken Road 2 has InOut’s stated 95.5% RTP, which leaves a 4.5% long-run house edge. Use that published percentage when comparing the two versions over the long run. Its road lengths, starting coefficients and maximum-win cap describe different features from its theoretical return. They describe other game properties, so none should be used as a measure of theoretical return.
If a casino page gives the sequel a percentage, ask where that exact figure comes from and whether it names this version. A number attached to the original title cannot answer the sequel question. Leave the comparison incomplete until a relevant source answers it, even if that feels less tidy than a table with every cell filled.
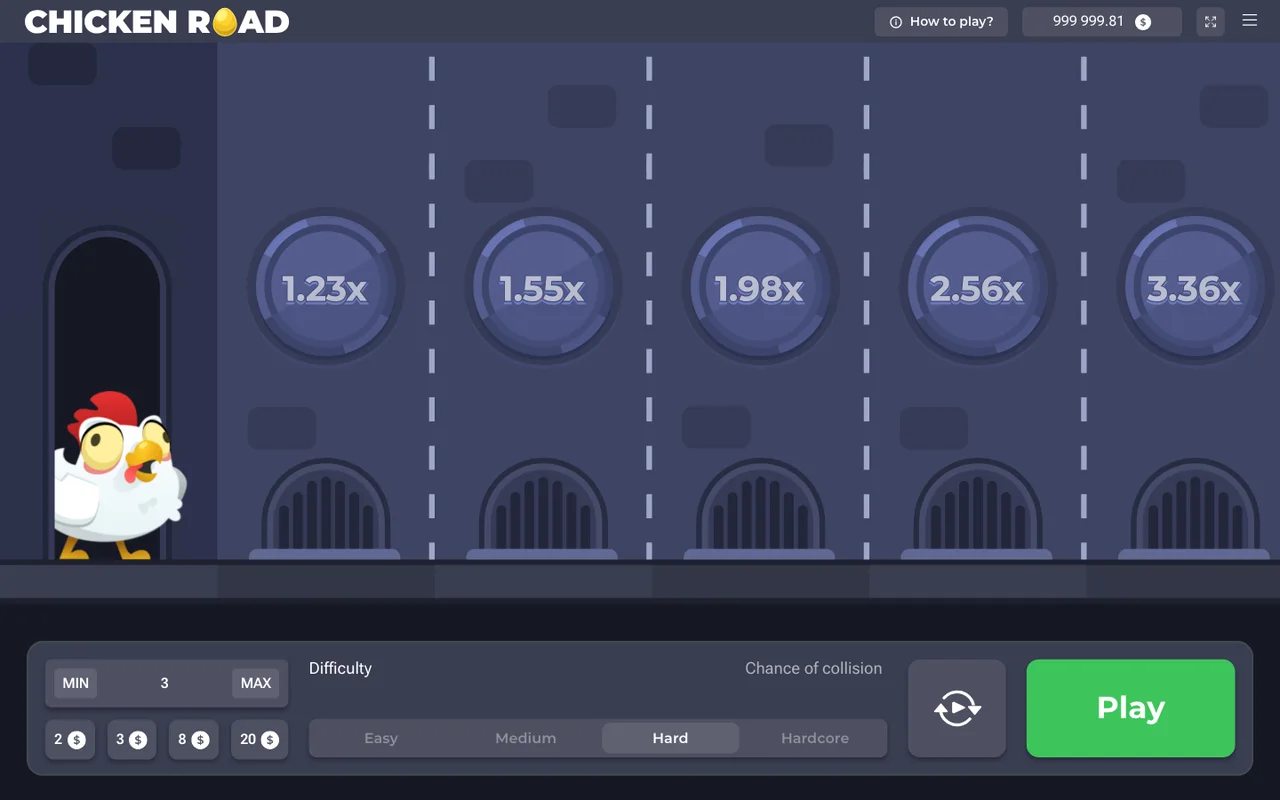
A useful demo check begins with the version label and difficulty selector. Next, locate the stake, the button that advances the chicken and the control that collects. After a successful move, see how the display marks the reached position. Collect and watch which values remain visible when the round ends.
Then change the mode before another practice attempt. This helps you recognise the screen after a casino opens a different setting. Demo credits cannot be withdrawn, and they do not sit in your cash wallet. Practice is a way to reduce confusion about controls, rather than a test of your ability to predict random results.
The game can appear inside an operator’s lobby, while that operator handles deposits, verification and withdrawals. Look beyond the game frame for the business name, licence details and support route. Check the licence against the relevant regulator’s register where available, matching the casino address rather than only the trading name.
Location restrictions need a separate check too. Gambling law varies, and a casino accepting a page visit does not answer whether cash play is permitted for you. Read the local rules and the operator’s accepted-location list. The sequel’s provider name tells you who made the game, rather than who may lawfully hold your account.
Questions about lawful access belong with the casino checks. For account and payment procedures, read the login and withdrawal explanation.
A promotion can list Chicken Road 2 differently from the original. Read the offer’s game list, contribution rate, bet restriction and expiry. If the title is absent or the wording groups games unclearly, ask the operator to explain it before activating the offer. A lobby banner is only the start of that check.
A bonus balance may also have different withdrawal conditions from a cash balance. Read which balance a bet uses and what happens if you cancel the promotion. These are operator questions, so a multiplier table cannot answer them. You can examine the sequel without accepting an offer or making its wagering target part of your budget.
On a small screen, the game needs enough room for the current return and collect control to remain legible. Check what happens when the browser bar moves or the phone changes orientation. If a pop-up hides a value, close it before making another decision. Clear labels matter more than filling every part of the display.
Avoid using an unknown installer as a shortcut to the casino. A familiar chicken icon does not identify the operator holding the account. Start from the address you checked, then open the title from that lobby. Keep passwords and identity documents inside the operator’s intended account process rather than sending them to a messenger contact.
Demo results can show how far the included rounds went on a named difficulty. The round total and dates help you see the size and timing of that run. Read those labels before comparing it with a different mode or the original. A high reached coefficient describes an outcome within those rounds.
The charts cannot verify published theoretical RTP or identify the next winning step. Nor can a practice return prove the casino’s withdrawal service. Treat the charts as a view of the rounds shown, then use the game rules and operator terms for their separate questions. Keeping those sources apart gives the comparison a clearer purpose.
The sequel offers longer roads across its four modes, a different stake range and a higher game win cap. Those are concrete reasons to compare it with the original in demo. The lower RTP remains a material difference: 95.5% for the sequel versus 98% for the original, despite its extra steps and higher limits.
Choose your next page by the unanswered question. Use the version comparison for the ladders, the bonus page for offer terminology and the account page for cashier checks. If you only want to see how the sequel feels on your screen, the demo is enough. A game review does not require you to open a cash account.
For adults 18+. Set an affordable spending limit and an end time, take breaks and never chase losses. Keep bill money away from play. If you feel pushed to raise the stake after a setback, close the game and step away.
Chicken Road 2
| Difficulty chosen | Total positions | Starting multiplier | Final multiplier | Hazards in view |
|---|---|---|---|---|
| Easy road | 30 | 1.01× | 23.24× | Figure currently unavailable |
| Medium road | 25 | 1.08× | 2,457× | Figure currently unavailable |
| Hard road | 22 | 1.18× | 62,162.09× | Figure currently unavailable |
| Daredevil road | 18 | 1.44× | 3,608,855.25× | Figure currently unavailable |
The sequel has 30 Easy positions, beginning at ×1.01 and ending at ×23.24. The original Easy road uses a different sequence.
InOut states its RTP as 95.5%, implying a 4.5% long-run house edge. A percentage attached to the original cannot be carried over to Chicken Road 2.
The game’s stake range starts at 0.12 USD and extends to 200 USD. A casino’s deposit requirements are separate from that range.
You can collect a reached return instead of continuing to the next position. The collect control ends that attempt; it is separate from a cashier withdrawal.
A promotion may treat each title differently. Read the exact game list and wagering contribution, and ask the operator if the sequel’s status is unclear.
Chicken Road 2 has a 20,000 USD maximum-win cap. The large final coefficients do not remove that payment ceiling.
| Reached position | Multiplier at this position | Modelled chance of reaching this point | Rounds that reached this point | Return including your initial stake |
|---|---|---|---|---|
| 1 | 1.01× | 94.55% | 96.87% | 0.978 |
| 2 | 1.03× | 92.72% | 92.73% | 0.955 |
| 3 | 1.06× | 90.09% | 89.33% | 0.947 |
| 4 | 1.1× | 86.82% | 86.27% | 0.949 |
| 5 | 1.15× | 83.04% | 82.47% | 0.948 |
| 6 | 1.19× | 80.25% | 79.33% | 0.944 |
| 7 | 1.24× | 77.02% | 76.4% | 0.947 |
| 8 | 1.3× | 73.46% | 73.27% | 0.952 |
| 9 | 1.35× | 70.74% | 70.07% | 0.946 |
| 10 | 1.42× | 67.25% | 67.07% | 0.952 |
| 11 | 1.48× | 64.53% | 64% | 0.947 |
| 12 | 1.56× | 61.22% | 61.2% | 0.955 |
| 13 | 1.65× | 57.88% | 57.73% | 0.953 |
| 14 | 1.75× | 54.57% | 55.2% | 0.966 |
| 15 | 1.85× | 51.62% | 52.13% | 0.964 |
| 16 | 1.98× | 48.23% | 48.87% | 0.968 |
| 17 | 2.12× | 45.05% | 45.4% | 0.962 |
| 18 | 2.28× | 41.89% | 42.67% | 0.973 |
| 19 | 2.47× | 38.66% | 39.53% | 0.976 |
| 20 | 2.7× | 35.37% | 35.6% | 0.961 |
| 21 | 2.96× | 32.26% | 33.07% | 0.979 |
| 22 | 3.28× | 29.12% | 29.87% | 0.98 |
| 23 | 3.7× | 25.81% | 27.07% | 1.001 |
| 24 | 4.11× | 23.24% | 24.33% | 1 |
| 25 | 4.64× | 20.58% | 20.53% | 0.953 |
| 26 | 5.39× | 17.72% | 16.73% | 0.902 |
| 27 | 6.5× | 14.69% | 13.2% | 0.858 |
| 28 | 8.36× | 11.42% | 9.47% | 0.791 |
| 29 | 12.08× | 7.91% | 5.93% | 0.717 |
| 30 | 23.24× | 4.11% | 2.67% | 0.62 |
| Reached position | Multiplier at this position | Modelled chance of reaching this point | Rounds that reached this point | Return including your initial stake |
|---|---|---|---|---|
| 1 | 1.08× | 88.43% | 89.87% | 0.971 |
| 2 | 1.21× | 78.93% | 79.07% | 0.957 |
| 3 | 1.37× | 69.71% | 69.73% | 0.955 |
| 4 | 1.56× | 61.22% | 61.47% | 0.959 |
| 5 | 1.78× | 53.65% | 51.73% | 0.921 |
| 6 | 2.05× | 46.59% | 43.47% | 0.891 |
| 7 | 2.37× | 40.3% | 37.27% | 0.883 |
| 8 | 2.77× | 34.48% | 31.6% | 0.875 |
| 9 | 3.24× | 29.48% | 27.2% | 0.881 |
| 10 | 3.85× | 24.81% | 23.27% | 0.896 |
| 11 | 4.62× | 20.67% | 19.4% | 0.896 |
| 12 | 5.61× | 17.02% | 16.07% | 0.901 |
| 13 | 6.91× | 13.82% | 13.33% | 0.921 |
| 14 | 8.64× | 11.05% | 10.8% | 0.933 |
| 15 | 10.99× | 8.69% | 8.67% | 0.952 |
| 16 | 14.29× | 6.68% | 6.6% | 0.943 |
| 17 | 18.96× | 5.04% | 5.07% | 0.961 |
| 18 | 26.07× | 3.66% | 3.4% | 0.886 |
| 19 | 37.24× | 2.56% | 2.07% | 0.77 |
| 20 | 53.82× | 1.77% | 1.2% | 0.646 |
| 21 | 82.36× | 1.16% | 0.67% | 0.549 |
| 22 | 137.59× | 0.69% | 0.47% | 0.642 |
| 23 | 265.35× | 0.36% | 0.2% | 0.531 |
| 24 | 638.82× | 0.15% | 0.13% | 0.852 |
| 25 | 2,457× | 0.04% | 0% | 0 |
| Reached position | Multiplier at this position | Modelled chance of reaching this point | Rounds that reached this point | Return including your initial stake |
|---|---|---|---|---|
| 1 | 1.18× | 80.93% | 79.07% | 0.933 |
| 2 | 1.46× | 65.41% | 63.27% | 0.924 |
| 3 | 1.83× | 52.19% | 50.67% | 0.927 |
| 4 | 2.31× | 41.34% | 40.13% | 0.927 |
| 5 | 2.95× | 32.37% | 31.4% | 0.926 |
| 6 | 3.82× | 25% | 23.47% | 0.896 |
| 7 | 5.02× | 19.02% | 18.2% | 0.914 |
| 8 | 6.66× | 14.34% | 14.4% | 0.959 |
| 9 | 9.04× | 10.56% | 10.27% | 0.928 |
| 10 | 12.52× | 7.63% | 7.13% | 0.893 |
| 11 | 17.74× | 5.38% | 5.2% | 0.922 |
| 12 | 25.8× | 3.7% | 3.4% | 0.877 |
| 13 | 38.71× | 2.47% | 2.33% | 0.903 |
| 14 | 60.21× | 1.59% | 1.33% | 0.803 |
| 15 | 97.34× | 0.98% | 1.07% | 1.038 |
| 16 | 166.87× | 0.57% | 0.67% | 1.112 |
| 17 | 305.94× | 0.31% | 0.47% | 1.428 |
| 18 | 595.86× | 0.16% | 0.33% | 1.986 |
| 19 | 1,283.03× | 0.07% | 0.13% | 1.711 |
| 20 | 3,267.64× | 0.03% | 0.13% | 4.357 |
| 21 | 10,898.54× | 0.01% | 0.07% | 7.266 |
| 22 | 62,162.09× | 0% | 0% | 0 |
| Reached position | Multiplier at this position | Modelled chance of reaching this point | Rounds that reached this point | Return including your initial stake |
|---|---|---|---|---|
| 1 | 1.44× | 66.32% | 67% | 0.965 |
| 2 | 2.21× | 43.21% | 42.33% | 0.936 |
| 3 | 3.45× | 27.68% | 26% | 0.897 |
| 4 | 5.53× | 17.27% | 15.93% | 0.881 |
| 5 | 9.09× | 10.51% | 9.87% | 0.897 |
| 6 | 15.3× | 6.24% | 6.33% | 0.969 |
| 7 | 26.78× | 3.57% | 3.53% | 0.946 |
| 8 | 48.7× | 1.96% | 2.13% | 1.039 |
| 9 | 92.54× | 1.03% | 0.93% | 0.864 |
| 10 | 185.08× | 0.52% | 0.47% | 0.864 |
| 11 | 391.25× | 0.24% | 0.33% | 1.304 |
| 12 | 894.28× | 0.11% | 0.13% | 1.192 |
| 13 | 2,235.72× | 0.04% | 0% | 0 |
| 14 | 6,096.15× | 0.02% | 0% | 0 |
| 15 | 18,960.33× | 0.01% | 0% | 0 |
| 16 | 72,432.75× | 0% | 0% | 0 |
| 17 | 379,632.82× | 0% | 0% | 0 |
| 18 | 3,608,855.25× | 0% | 0% | 0 |
Gross return includes your original stake. Payment caps apply. This is no profit prediction.
These figures describe our captured demo rounds. They cannot predict outcomes or verify RTP.
Published theoretical return: 98% · Maximum game payout: 10,000 USD
We have not independently audited this RNG.
Verification needs an algorithm and advance commitment. Afterwards, revealed seeds and nonce are required.
Inside the recorded sample
Every curve retains its starting denominator. Wilson intervals apply to individual positions. They are not simultaneous confidence bands.
Demo rounds counted: 6,000
Share reaching each successful step
| Game | Difficulty chosen | Demo rounds counted | Step one survival | Uncertainty around this share | Completed roads | Highest multiplier reached |
|---|---|---|---|---|---|---|
| Chicken Road 2 · Easy road | Easy road | 1,500 | 96.87% | 95.86%–97.64% | 40 | 23.24× |
| Chicken Road 2 · Medium road | Medium road | 1,500 | 89.87% | 88.24%–91.29% | 0 | 638.82× |
| Chicken Road 2 · Hard road | Hard road | 1,500 | 79.07% | 76.93%–81.05% | 0 | 10,898.54× |
| Chicken Road 2 · Daredevil road | Daredevil road | 1,500 | 67% | 64.58%–69.33% | 0 | 894.28× |
Best reached counts successful step coefficients. Later losses remain included. This is no paid win.
| Reached position | Successful rounds | Demo rounds counted | Rounds that reached this point | Uncertainty around this share |
|---|---|---|---|---|
| 1 | 1,453 | 1,500 | 96.87% | 95.86%–97.64% |
| 2 | 1,391 | 1,500 | 92.73% | 91.31%–93.94% |
| 3 | 1,340 | 1,500 | 89.33% | 87.67%–90.8% |
| 4 | 1,294 | 1,500 | 86.27% | 84.43%–87.92% |
| 5 | 1,237 | 1,500 | 82.47% | 80.46%–84.31% |
| 6 | 1,190 | 1,500 | 79.33% | 77.21%–81.31% |
| 7 | 1,146 | 1,500 | 76.4% | 74.19%–78.48% |
| 8 | 1,099 | 1,500 | 73.27% | 70.97%–75.44% |
| 9 | 1,051 | 1,500 | 70.07% | 67.7%–72.33% |
| 10 | 1,006 | 1,500 | 67.07% | 64.65%–69.4% |
| 11 | 960 | 1,500 | 64% | 61.54%–66.39% |
| 12 | 918 | 1,500 | 61.2% | 58.71%–63.63% |
| 13 | 866 | 1,500 | 57.73% | 55.22%–60.21% |
| 14 | 828 | 1,500 | 55.2% | 52.67%–57.7% |
| 15 | 782 | 1,500 | 52.13% | 49.6%–54.65% |
| 16 | 733 | 1,500 | 48.87% | 46.34%–51.4% |
| 17 | 681 | 1,500 | 45.4% | 42.9%–47.93% |
| 18 | 640 | 1,500 | 42.67% | 40.19%–45.19% |
| 19 | 593 | 1,500 | 39.53% | 37.09%–42.03% |
| 20 | 534 | 1,500 | 35.6% | 33.22%–38.06% |
| 21 | 496 | 1,500 | 33.07% | 30.73%–35.49% |
| 22 | 448 | 1,500 | 29.87% | 27.6%–32.23% |
| 23 | 406 | 1,500 | 27.07% | 24.88%–29.37% |
| 24 | 365 | 1,500 | 24.33% | 22.23%–26.57% |
| 25 | 308 | 1,500 | 20.53% | 18.57%–22.65% |
| 26 | 251 | 1,500 | 16.73% | 14.93%–18.71% |
| 27 | 198 | 1,500 | 13.2% | 11.58%–15.01% |
| 28 | 142 | 1,500 | 9.47% | 8.09%–11.05% |
| 29 | 89 | 1,500 | 5.93% | 4.85%–7.25% |
| 30 | 40 | 1,500 | 2.67% | 1.96%–3.61% |
| Reached position | Successful rounds | Demo rounds counted | Rounds that reached this point | Uncertainty around this share |
|---|---|---|---|---|
| 1 | 1,348 | 1,500 | 89.87% | 88.24%–91.29% |
| 2 | 1,186 | 1,500 | 79.07% | 76.93%–81.05% |
| 3 | 1,046 | 1,500 | 69.73% | 67.36%–72.01% |
| 4 | 922 | 1,500 | 61.47% | 58.98%–63.9% |
| 5 | 776 | 1,500 | 51.73% | 49.2%–54.25% |
| 6 | 652 | 1,500 | 43.47% | 40.98%–45.99% |
| 7 | 559 | 1,500 | 37.27% | 34.86%–39.74% |
| 8 | 474 | 1,500 | 31.6% | 29.3%–34% |
| 9 | 408 | 1,500 | 27.2% | 25.01%–29.51% |
| 10 | 349 | 1,500 | 23.27% | 21.2%–25.47% |
| 11 | 291 | 1,500 | 19.4% | 17.48%–21.48% |
| 12 | 241 | 1,500 | 16.07% | 14.3%–18.01% |
| 13 | 200 | 1,500 | 13.33% | 11.71%–15.15% |
| 14 | 162 | 1,500 | 10.8% | 9.33%–12.47% |
| 15 | 130 | 1,500 | 8.67% | 7.35%–10.2% |
| 16 | 99 | 1,500 | 6.6% | 5.45%–7.97% |
| 17 | 76 | 1,500 | 5.07% | 4.07%–6.3% |
| 18 | 51 | 1,500 | 3.4% | 2.6%–4.44% |
| 19 | 31 | 1,500 | 2.07% | 1.46%–2.92% |
| 20 | 18 | 1,500 | 1.2% | 0.76%–1.89% |
| 21 | 10 | 1,500 | 0.67% | 0.36%–1.22% |
| 22 | 7 | 1,500 | 0.47% | 0.23%–0.96% |
| 23 | 3 | 1,500 | 0.2% | 0.07%–0.59% |
| 24 | 2 | 1,500 | 0.13% | 0.04%–0.48% |
| 25 | 0 | 1,500 | 0% | 0%–0.26% |
| Reached position | Successful rounds | Demo rounds counted | Rounds that reached this point | Uncertainty around this share |
|---|---|---|---|---|
| 1 | 1,186 | 1,500 | 79.07% | 76.93%–81.05% |
| 2 | 949 | 1,500 | 63.27% | 60.8%–65.67% |
| 3 | 760 | 1,500 | 50.67% | 48.14%–53.19% |
| 4 | 602 | 1,500 | 40.13% | 37.68%–42.64% |
| 5 | 471 | 1,500 | 31.4% | 29.1%–33.79% |
| 6 | 352 | 1,500 | 23.47% | 21.39%–25.68% |
| 7 | 273 | 1,500 | 18.2% | 16.33%–20.23% |
| 8 | 216 | 1,500 | 14.4% | 12.71%–16.27% |
| 9 | 154 | 1,500 | 10.27% | 8.83%–11.91% |
| 10 | 107 | 1,500 | 7.13% | 5.94%–8.55% |
| 11 | 78 | 1,500 | 5.2% | 4.19%–6.44% |
| 12 | 51 | 1,500 | 3.4% | 2.6%–4.44% |
| 13 | 35 | 1,500 | 2.33% | 1.68%–3.23% |
| 14 | 20 | 1,500 | 1.33% | 0.86%–2.05% |
| 15 | 16 | 1,500 | 1.07% | 0.66%–1.73% |
| 16 | 10 | 1,500 | 0.67% | 0.36%–1.22% |
| 17 | 7 | 1,500 | 0.47% | 0.23%–0.96% |
| 18 | 5 | 1,500 | 0.33% | 0.14%–0.78% |
| 19 | 2 | 1,500 | 0.13% | 0.04%–0.48% |
| 20 | 2 | 1,500 | 0.13% | 0.04%–0.48% |
| 21 | 1 | 1,500 | 0.07% | 0.01%–0.38% |
| 22 | 0 | 1,500 | 0% | 0%–0.26% |
| Reached position | Successful rounds | Demo rounds counted | Rounds that reached this point | Uncertainty around this share |
|---|---|---|---|---|
| 1 | 1,005 | 1,500 | 67% | 64.58%–69.33% |
| 2 | 635 | 1,500 | 42.33% | 39.86%–44.85% |
| 3 | 390 | 1,500 | 26% | 23.84%–28.28% |
| 4 | 239 | 1,500 | 15.93% | 14.17%–17.87% |
| 5 | 148 | 1,500 | 9.87% | 8.46%–11.48% |
| 6 | 95 | 1,500 | 6.33% | 5.21%–7.68% |
| 7 | 53 | 1,500 | 3.53% | 2.71%–4.59% |
| 8 | 32 | 1,500 | 2.13% | 1.52%–3% |
| 9 | 14 | 1,500 | 0.93% | 0.56%–1.56% |
| 10 | 7 | 1,500 | 0.47% | 0.23%–0.96% |
| 11 | 5 | 1,500 | 0.33% | 0.14%–0.78% |
| 12 | 2 | 1,500 | 0.13% | 0.04%–0.48% |
| 13 | 0 | 1,500 | 0% | 0%–0.26% |
| 14 | 0 | 1,500 | 0% | 0%–0.26% |
| 15 | 0 | 1,500 | 0% | 0%–0.26% |
| 16 | 0 | 1,500 | 0% | 0%–0.26% |
| 17 | 0 | 1,500 | 0% | 0%–0.26% |
| 18 | 0 | 1,500 | 0% | 0%–0.26% |
Demo results do not certify RNG. They cannot verify long-run RTP. They cannot forecast real-money outcomes.
Model: stated RTP divided by the multiplier. We have not independently validated this model.
| Reached position | Rounds that reached this point | Uncertainty around this share | Modelled chance of reaching this point |
|---|---|---|---|
| 1 | 96.87% | 95.86% – 97.64% | 94.55% |
| 2 | 92.73% | 91.31% – 93.94% | 92.72% |
| 3 | 89.33% | 87.67% – 90.8% | 90.09% |
| 4 | 86.27% | 84.43% – 87.92% | 86.82% |
| 5 | 82.47% | 80.46% – 84.31% | 83.04% |
| 6 | 79.33% | 77.21% – 81.31% | 80.25% |
| 7 | 76.4% | 74.19% – 78.48% | 77.02% |
| 8 | 73.27% | 70.97% – 75.44% | 73.46% |
| 9 | 70.07% | 67.7% – 72.33% | 70.74% |
| 10 | 67.07% | 64.65% – 69.4% | 67.25% |
| 11 | 64% | 61.54% – 66.39% | 64.53% |
| 12 | 61.2% | 58.71% – 63.63% | 61.22% |
| 13 | 57.73% | 55.22% – 60.21% | 57.88% |
| 14 | 55.2% | 52.67% – 57.7% | 54.57% |
| 15 | 52.13% | 49.6% – 54.65% | 51.62% |
| 16 | 48.87% | 46.34% – 51.4% | 48.23% |
| 17 | 45.4% | 42.9% – 47.93% | 45.05% |
| 18 | 42.67% | 40.19% – 45.19% | 41.89% |
| 19 | 39.53% | 37.09% – 42.03% | 38.66% |
| 20 | 35.6% | 33.22% – 38.06% | 35.37% |
| 21 | 33.07% | 30.73% – 35.49% | 32.26% |
| 22 | 29.87% | 27.6% – 32.23% | 29.12% |
| 23 | 27.07% | 24.88% – 29.37% | 25.81% |
| 24 | 24.33% | 22.23% – 26.57% | 23.24% |
| 25 | 20.53% | 18.57% – 22.65% | 20.58% |
| 26 | 16.73% | 14.93% – 18.71% | 17.72% |
| 27 | 13.2% | 11.58% – 15.01% | 14.69% |
| 28 | 9.47% | 8.09% – 11.05% | 11.42% |
| 29 | 5.93% | 4.85% – 7.25% | 7.91% |
| 30 | 2.67% | 1.96% – 3.61% | 4.11% |
| Reached position | Rounds that reached this point | Uncertainty around this share | Modelled chance of reaching this point |
|---|---|---|---|
| 1 | 89.87% | 88.24% – 91.29% | 88.43% |
| 2 | 79.07% | 76.93% – 81.05% | 78.93% |
| 3 | 69.73% | 67.36% – 72.01% | 69.71% |
| 4 | 61.47% | 58.98% – 63.9% | 61.22% |
| 5 | 51.73% | 49.2% – 54.25% | 53.65% |
| 6 | 43.47% | 40.98% – 45.99% | 46.59% |
| 7 | 37.27% | 34.86% – 39.74% | 40.3% |
| 8 | 31.6% | 29.3% – 34% | 34.48% |
| 9 | 27.2% | 25.01% – 29.51% | 29.48% |
| 10 | 23.27% | 21.2% – 25.47% | 24.81% |
| 11 | 19.4% | 17.48% – 21.48% | 20.67% |
| 12 | 16.07% | 14.3% – 18.01% | 17.02% |
| 13 | 13.33% | 11.71% – 15.15% | 13.82% |
| 14 | 10.8% | 9.33% – 12.47% | 11.05% |
| 15 | 8.67% | 7.35% – 10.2% | 8.69% |
| 16 | 6.6% | 5.45% – 7.97% | 6.68% |
| 17 | 5.07% | 4.07% – 6.3% | 5.04% |
| 18 | 3.4% | 2.6% – 4.44% | 3.66% |
| 19 | 2.07% | 1.46% – 2.92% | 2.56% |
| 20 | 1.2% | 0.76% – 1.89% | 1.77% |
| 21 | 0.67% | 0.36% – 1.22% | 1.16% |
| 22 | 0.47% | 0.23% – 0.96% | 0.69% |
| 23 | 0.2% | 0.07% – 0.59% | 0.36% |
| 24 | 0.13% | 0.04% – 0.48% | 0.15% |
| 25 | 0% | 0% – 0.26% | 0.04% |
| Reached position | Rounds that reached this point | Uncertainty around this share | Modelled chance of reaching this point |
|---|---|---|---|
| 1 | 79.07% | 76.93% – 81.05% | 80.93% |
| 2 | 63.27% | 60.8% – 65.67% | 65.41% |
| 3 | 50.67% | 48.14% – 53.19% | 52.19% |
| 4 | 40.13% | 37.68% – 42.64% | 41.34% |
| 5 | 31.4% | 29.1% – 33.79% | 32.37% |
| 6 | 23.47% | 21.39% – 25.68% | 25% |
| 7 | 18.2% | 16.33% – 20.23% | 19.02% |
| 8 | 14.4% | 12.71% – 16.27% | 14.34% |
| 9 | 10.27% | 8.83% – 11.91% | 10.56% |
| 10 | 7.13% | 5.94% – 8.55% | 7.63% |
| 11 | 5.2% | 4.19% – 6.44% | 5.38% |
| 12 | 3.4% | 2.6% – 4.44% | 3.7% |
| 13 | 2.33% | 1.68% – 3.23% | 2.47% |
| 14 | 1.33% | 0.86% – 2.05% | 1.59% |
| 15 | 1.07% | 0.66% – 1.73% | 0.98% |
| 16 | 0.67% | 0.36% – 1.22% | 0.57% |
| 17 | 0.47% | 0.23% – 0.96% | 0.31% |
| 18 | 0.33% | 0.14% – 0.78% | 0.16% |
| 19 | 0.13% | 0.04% – 0.48% | 0.07% |
| 20 | 0.13% | 0.04% – 0.48% | 0.03% |
| 21 | 0.07% | 0.01% – 0.38% | 0.01% |
| 22 | 0% | 0% – 0.26% | 0% |
| Reached position | Rounds that reached this point | Uncertainty around this share | Modelled chance of reaching this point |
|---|---|---|---|
| 1 | 67% | 64.58% – 69.33% | 66.32% |
| 2 | 42.33% | 39.86% – 44.85% | 43.21% |
| 3 | 26% | 23.84% – 28.28% | 27.68% |
| 4 | 15.93% | 14.17% – 17.87% | 17.27% |
| 5 | 9.87% | 8.46% – 11.48% | 10.51% |
| 6 | 6.33% | 5.21% – 7.68% | 6.24% |
| 7 | 3.53% | 2.71% – 4.59% | 3.57% |
| 8 | 2.13% | 1.52% – 3% | 1.96% |
| 9 | 0.93% | 0.56% – 1.56% | 1.03% |
| 10 | 0.47% | 0.23% – 0.96% | 0.52% |
| 11 | 0.33% | 0.14% – 0.78% | 0.24% |
| 12 | 0.13% | 0.04% – 0.48% | 0.11% |
| 13 | 0% | 0% – 0.26% | 0.04% |
| 14 | 0% | 0% – 0.26% | 0.02% |
| 15 | 0% | 0% – 0.26% | 0.01% |
| 16 | 0% | 0% – 0.26% | 0% |
| 17 | 0% | 0% – 0.26% | 0% |
| 18 | 0% | 0% – 0.26% | 0% |
| Reached position | Multiplier at this position |
|---|---|
| 1 | 1.01× |
| 2 | 1.03× |
| 3 | 1.06× |
| 4 | 1.1× |
| 5 | 1.15× |
| 6 | 1.19× |
| 7 | 1.24× |
| 8 | 1.3× |
| 9 | 1.35× |
| 10 | 1.42× |
| 11 | 1.48× |
| 12 | 1.56× |
| 13 | 1.65× |
| 14 | 1.75× |
| 15 | 1.85× |
| 16 | 1.98× |
| 17 | 2.12× |
| 18 | 2.28× |
| 19 | 2.47× |
| 20 | 2.7× |
| 21 | 2.96× |
| 22 | 3.28× |
| 23 | 3.7× |
| 24 | 4.11× |
| 25 | 4.64× |
| 26 | 5.39× |
| 27 | 6.5× |
| 28 | 8.36× |
| 29 | 12.08× |
| 30 | 23.24× |
| Reached position | Multiplier at this position |
|---|---|
| 1 | 1.08× |
| 2 | 1.21× |
| 3 | 1.37× |
| 4 | 1.56× |
| 5 | 1.78× |
| 6 | 2.05× |
| 7 | 2.37× |
| 8 | 2.77× |
| 9 | 3.24× |
| 10 | 3.85× |
| 11 | 4.62× |
| 12 | 5.61× |
| 13 | 6.91× |
| 14 | 8.64× |
| 15 | 10.99× |
| 16 | 14.29× |
| 17 | 18.96× |
| 18 | 26.07× |
| 19 | 37.24× |
| 20 | 53.82× |
| 21 | 82.36× |
| 22 | 137.59× |
| 23 | 265.35× |
| 24 | 638.82× |
| 25 | 2,457× |
| Reached position | Multiplier at this position |
|---|---|
| 1 | 1.18× |
| 2 | 1.46× |
| 3 | 1.83× |
| 4 | 2.31× |
| 5 | 2.95× |
| 6 | 3.82× |
| 7 | 5.02× |
| 8 | 6.66× |
| 9 | 9.04× |
| 10 | 12.52× |
| 11 | 17.74× |
| 12 | 25.8× |
| 13 | 38.71× |
| 14 | 60.21× |
| 15 | 97.34× |
| 16 | 166.87× |
| 17 | 305.94× |
| 18 | 595.86× |
| 19 | 1,283.03× |
| 20 | 3,267.64× |
| 21 | 10,898.54× |
| 22 | 62,162.09× |
| Reached position | Multiplier at this position |
|---|---|
| 1 | 1.44× |
| 2 | 2.21× |
| 3 | 3.45× |
| 4 | 5.53× |
| 5 | 9.09× |
| 6 | 15.3× |
| 7 | 26.78× |
| 8 | 48.7× |
| 9 | 92.54× |
| 10 | 185.08× |
| 11 | 391.25× |
| 12 | 894.28× |
| 13 | 2,235.72× |
| 14 | 6,096.15× |
| 15 | 18,960.33× |
| 16 | 72,432.75× |
| 17 | 379,632.82× |
| 18 | 3,608,855.25× |
Adults 18+ only. Set spending and time limits. Take breaks. Never chase losses.